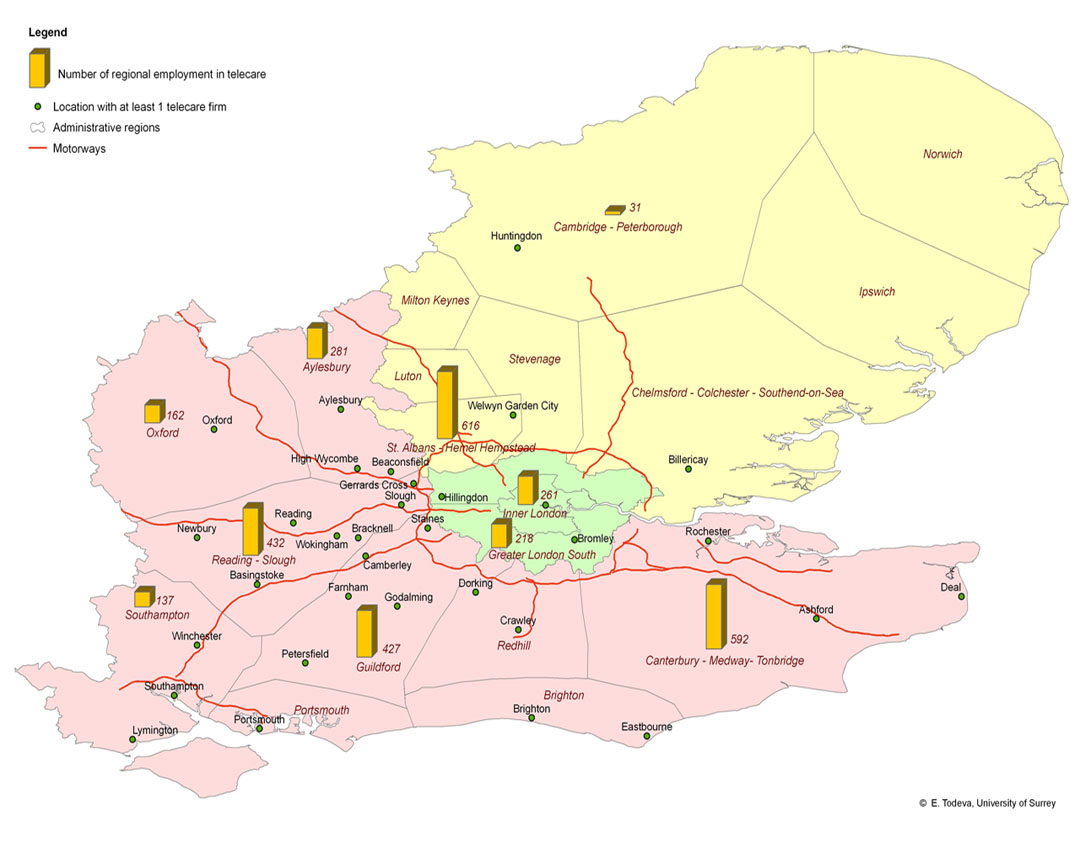
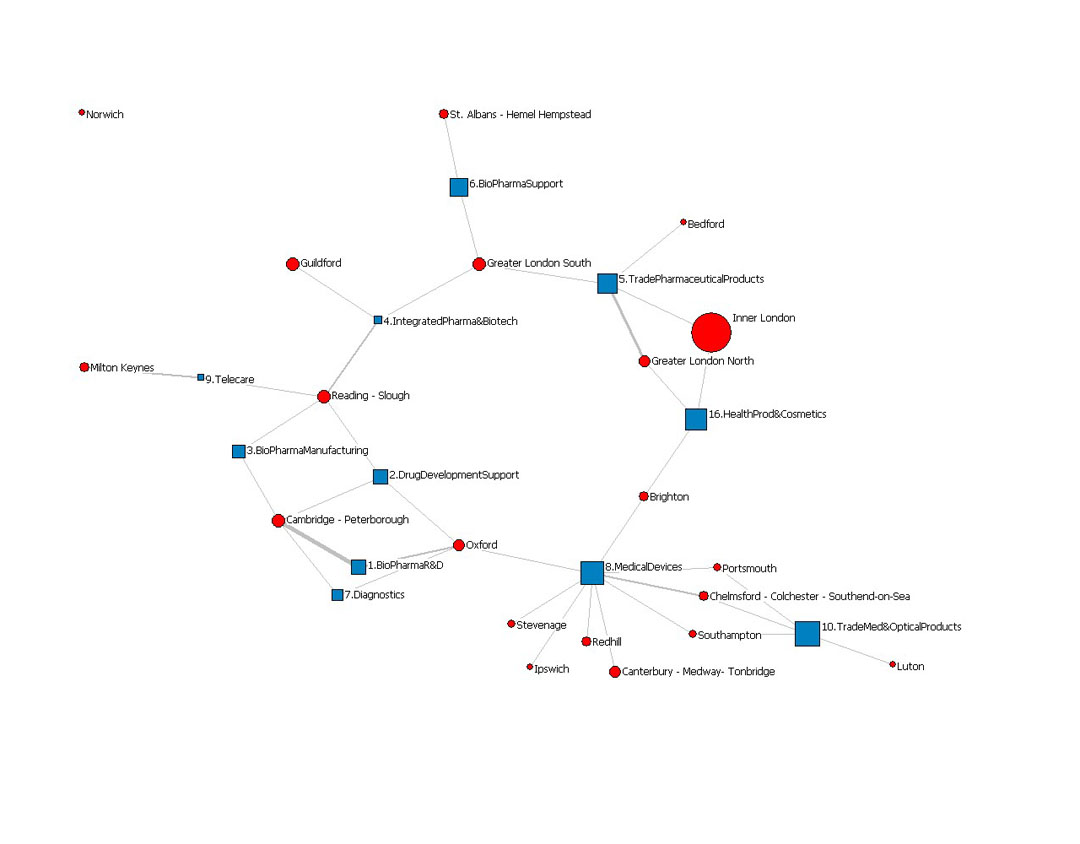
 Telecare capabilities in the South East of England, UK
(2008)
Regional telecare employment

Business Clusters, Networks & Economic Development Research Centre
Analylitical Maps:
In the world of analytical maps and data visualisation, our understanding and vision are guided by landscapes of colours that discriminate across unique patterns and characteristics within data sets. With the advancement of data analytics and new visualisation software we are now equipped with robust tools to compare across complex data, zooming in and out at micro, mezzo and macro level.
Graphic visualisation techniques give us new insights into the world of measurable and challenge further our capacity to combine intuition with experience and facts. The portfolio of analytical and mapping techniques, developed by the BCNED research centre, spread across structural, relational and semantic analysis, presenting complex networks and cluster of interconnected objects, while demarcating co-occurrence patterns, boundaries of impact and diffusion. Our analytical maps derive from bespoke datasets and uniquely collected and cleaned data and equip decision makers with detailed representations of hidden processes and outcomes..
Telecare capabilities in the South East of England, UK (2008)
Regional telecare employment
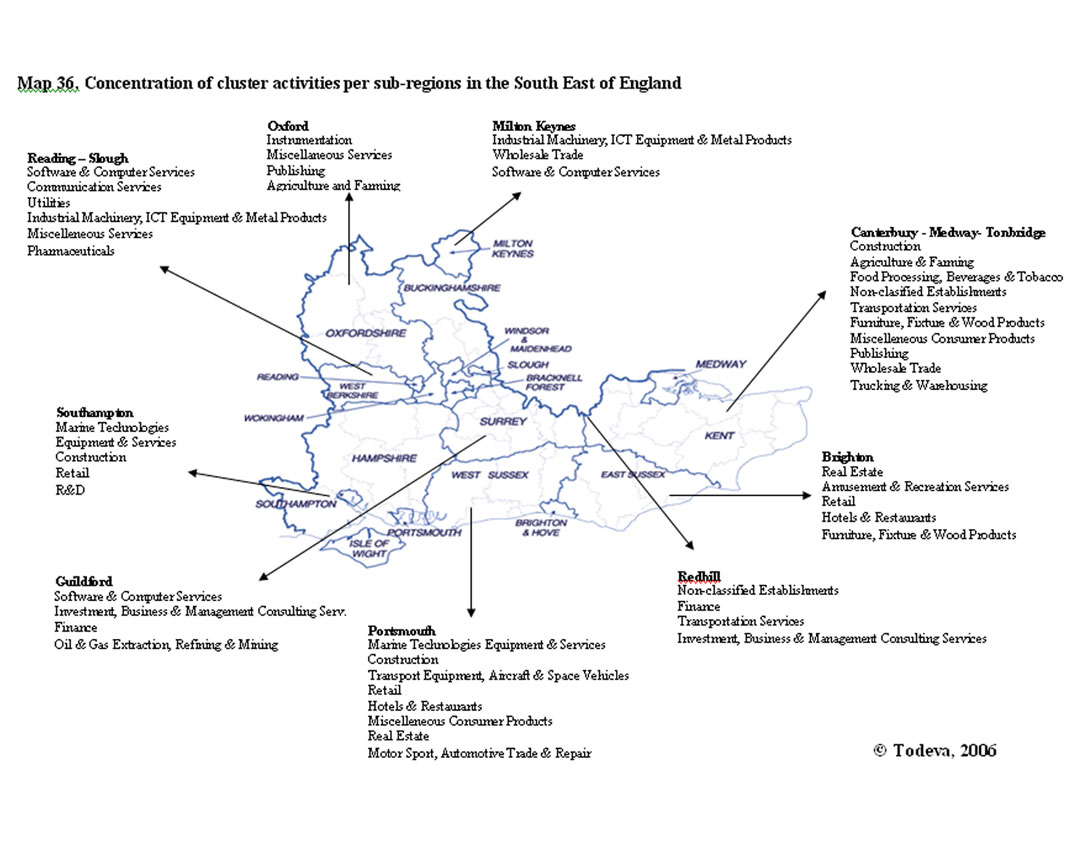
The structure of the regional economy, South East of England, UK (2006)
Regional telecare employment
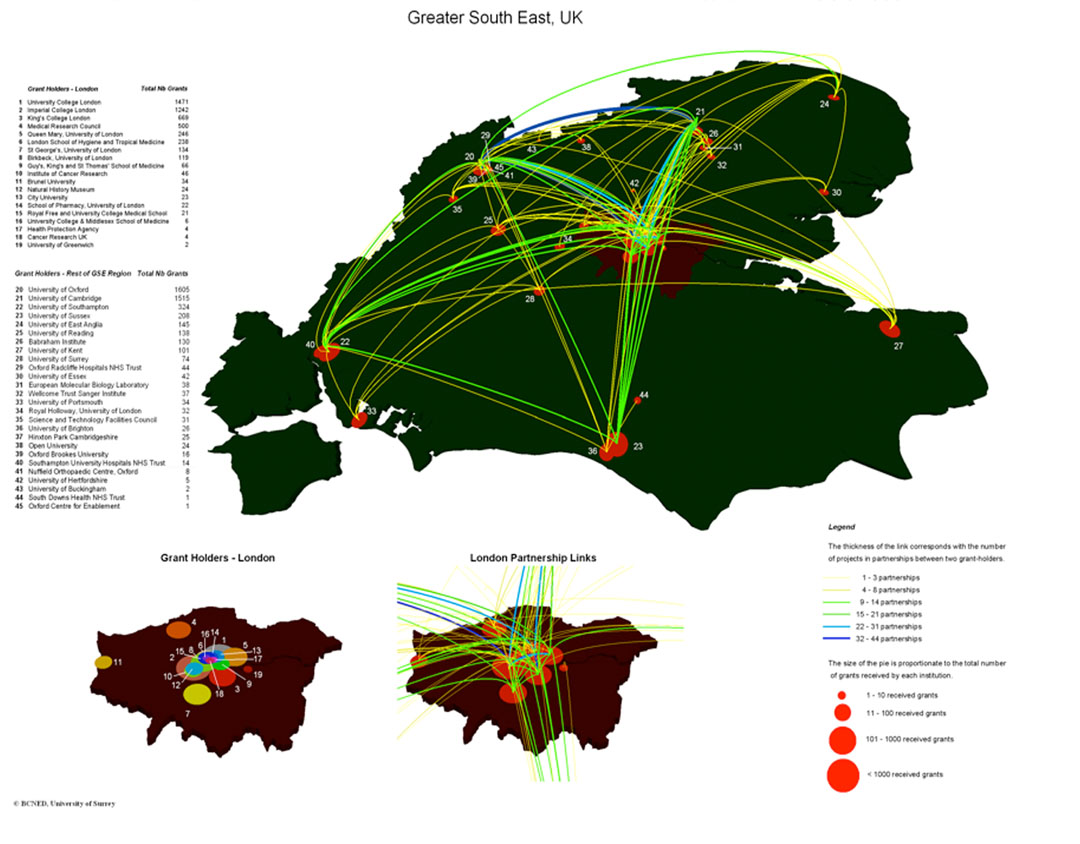
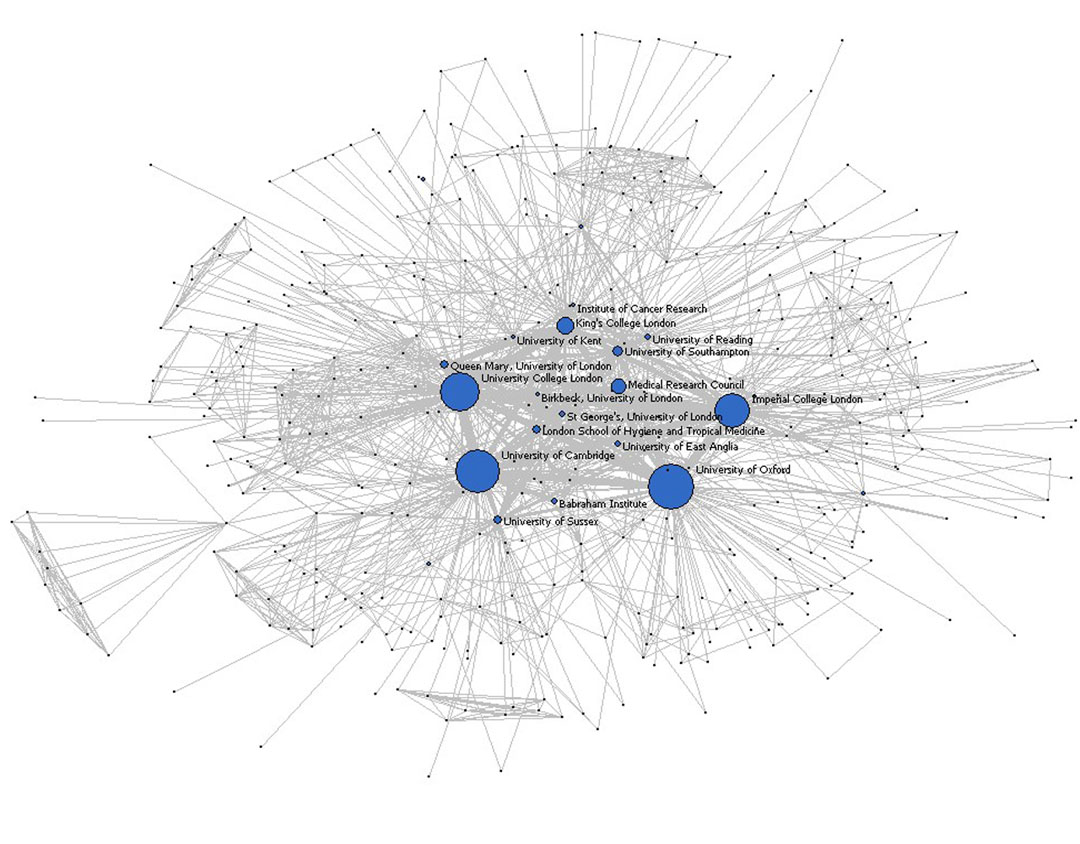
 Map of regional research collaborations in
health technology & medical science
Map of regional research collaborations in
health technology & medical science (2008)
Greater South East, UK, Cetres of Excellence
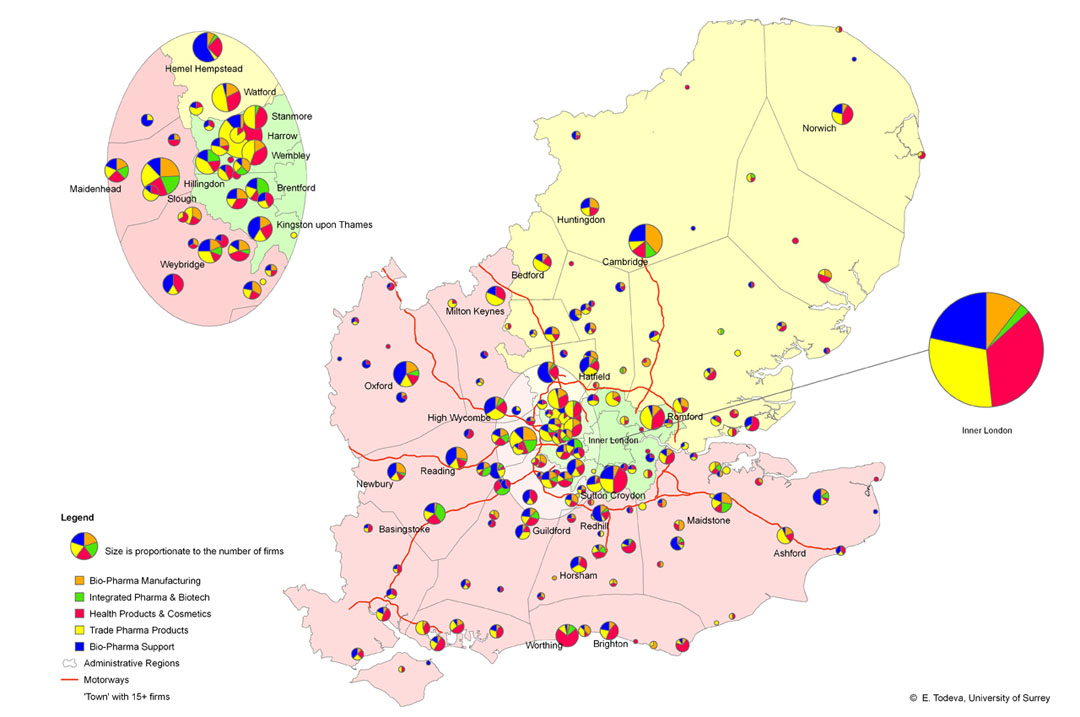
 Biopharma cluster in the Greater South East,
UK
Biopharma cluster in the Greater South East,
UK (2008)
Concentration of manufacturing capabilities
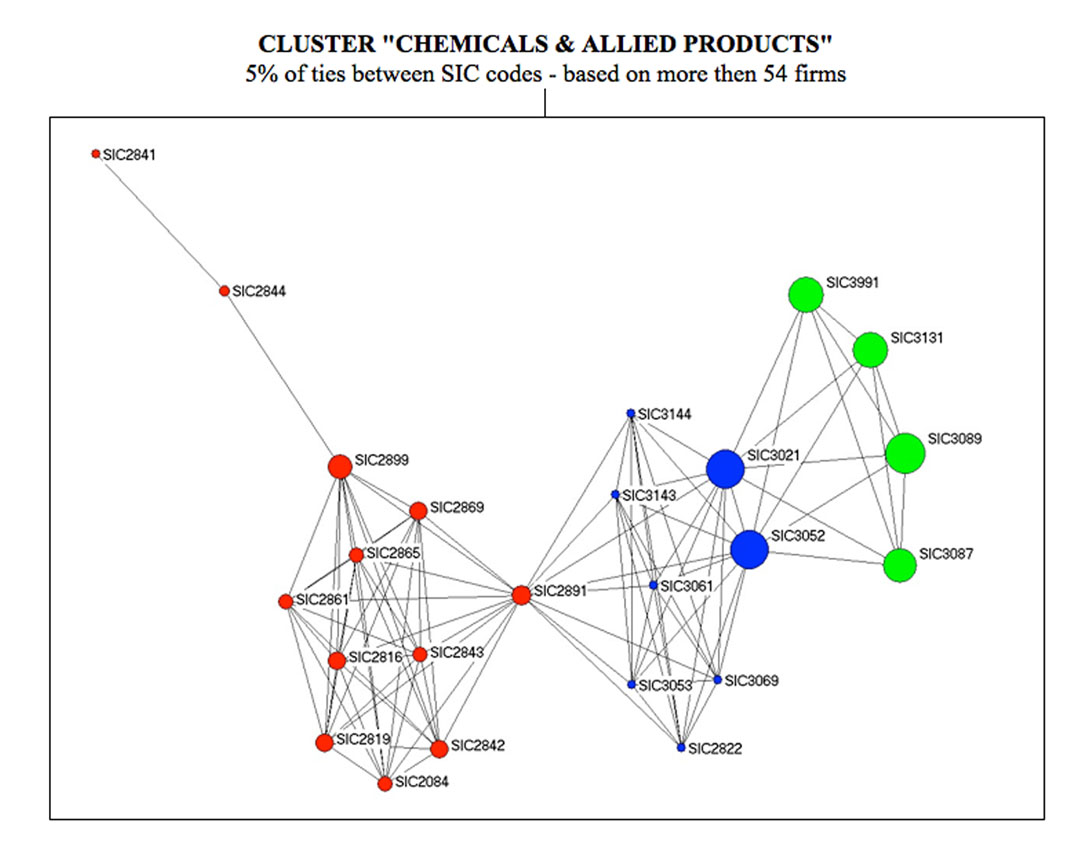
 Cluster 'Chemicals & allied products' in the South East of England, UK
(2006)
Specialized strategic industry groups within the chemical and allied products manufacturing
 Emerging patterns of research capabilities in the South East of England UK
(2006)
Patents and publications in bio-medical and health technology Field
 Research partnerships in biomedical and health technology research
 (UK funding 2000-2007)
Size of the dots represent received UK grants with global partnerships
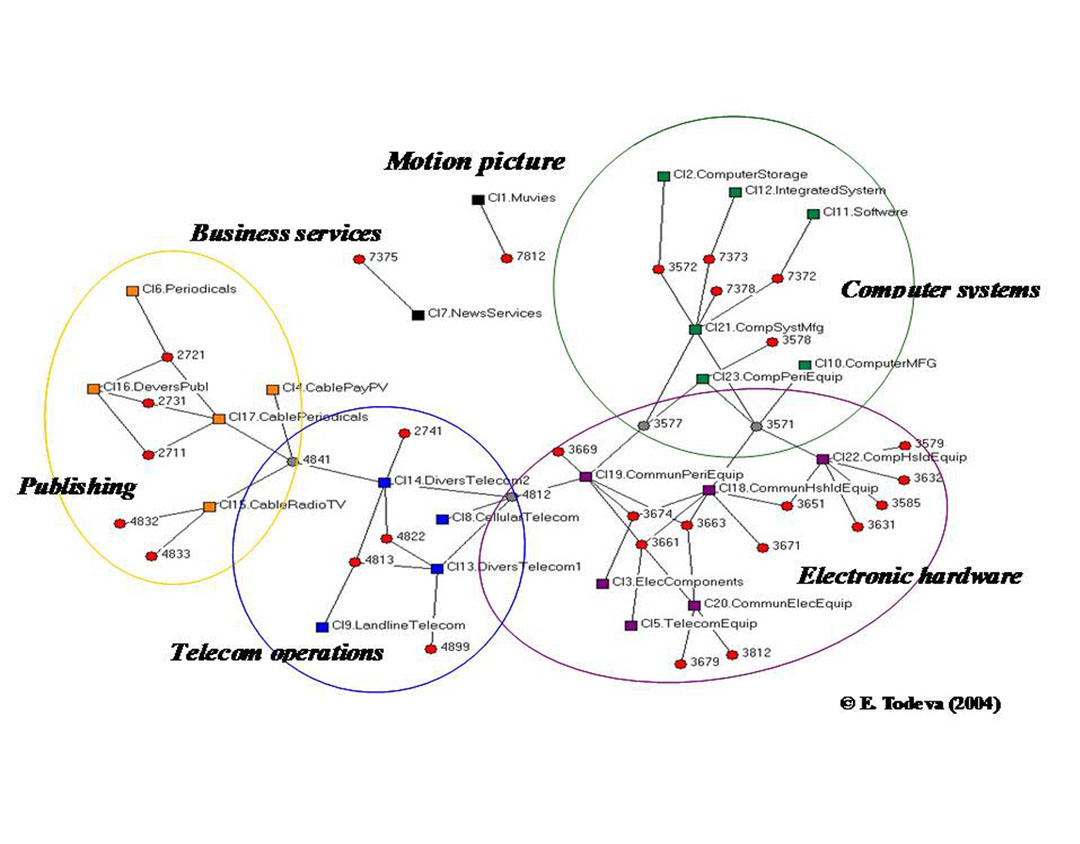
 Global inoformation sector integrated value
chain
Global inoformation sector integrated value
chain (2004)
Drivers in the digital economy, including telecoms, computer systems & electronic hardware
 Regional specialisation in the biomedical and health technology cluster in the Greater South East, UK
 (2008)
Size of the dots refers to number of firms in locations within the UK (2008)
 Biopharma global value chain (top 300 biopharma multinational corporations
 (2016)
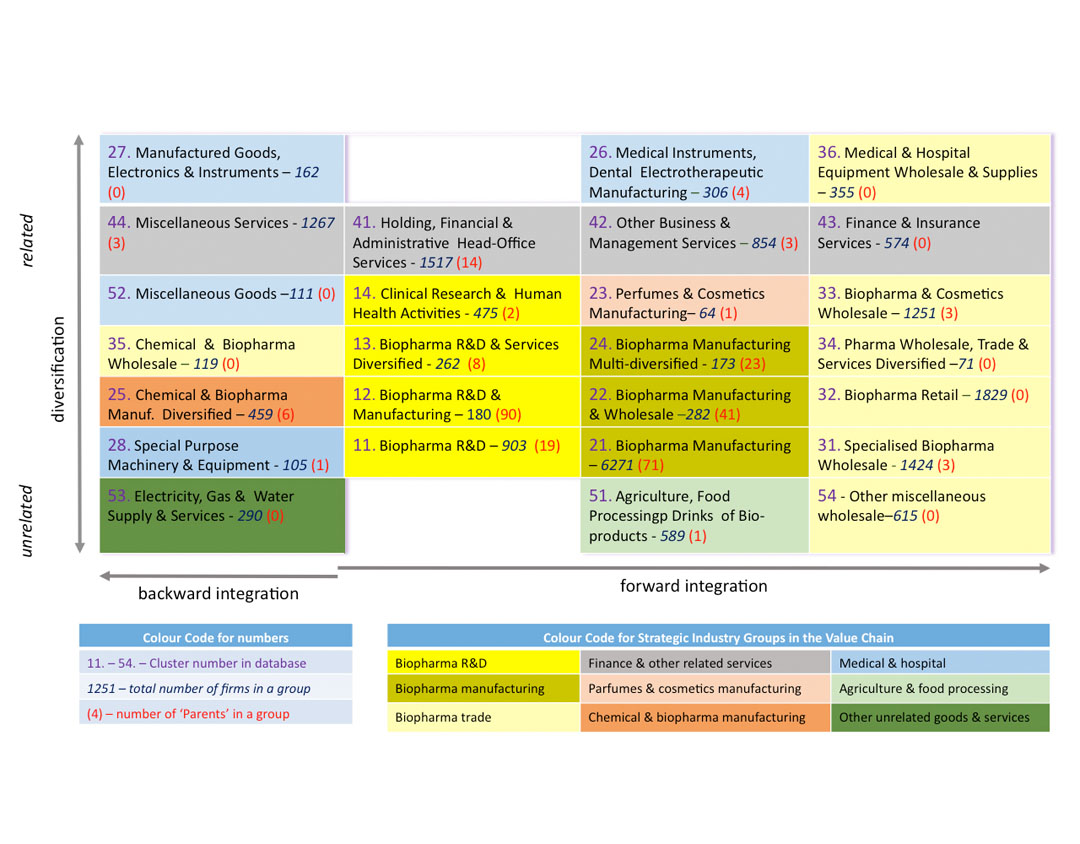
Related diversification and value added chains across all global biopharma parents and subsidiaries
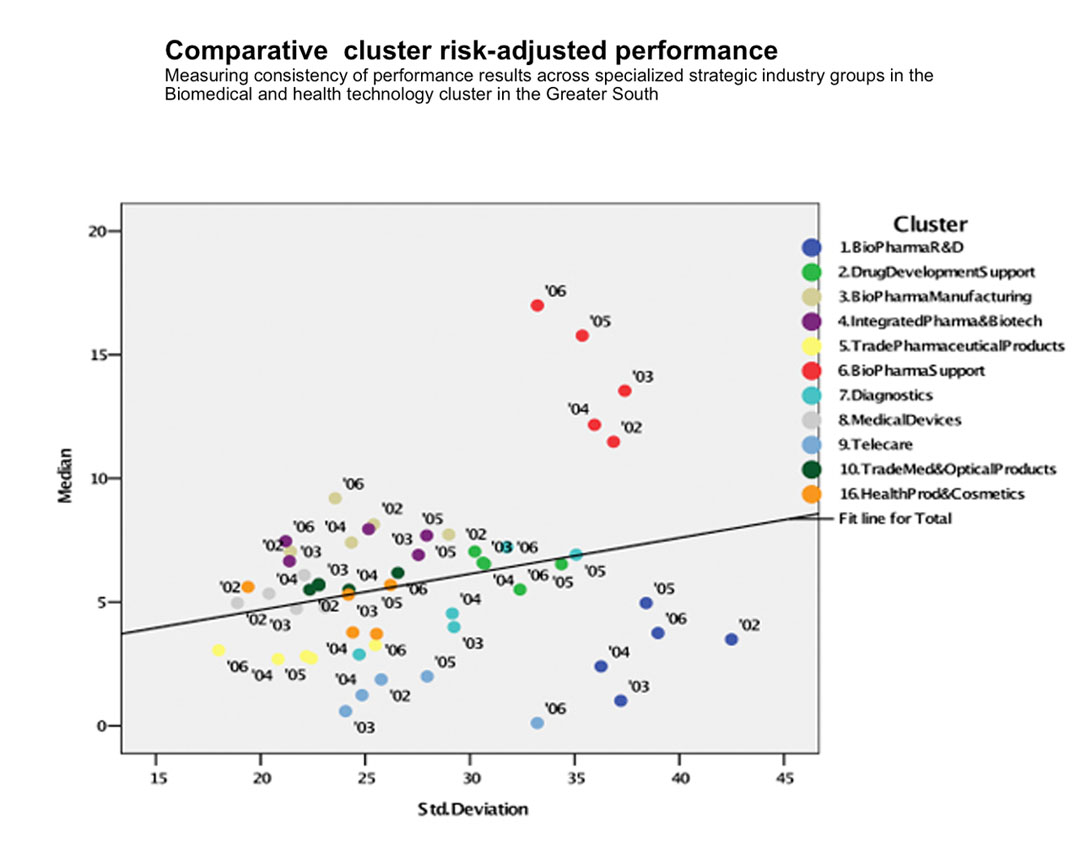
 Comparative cluster risk-adjusted performance in biomedical and health technology, UK
 (2008)
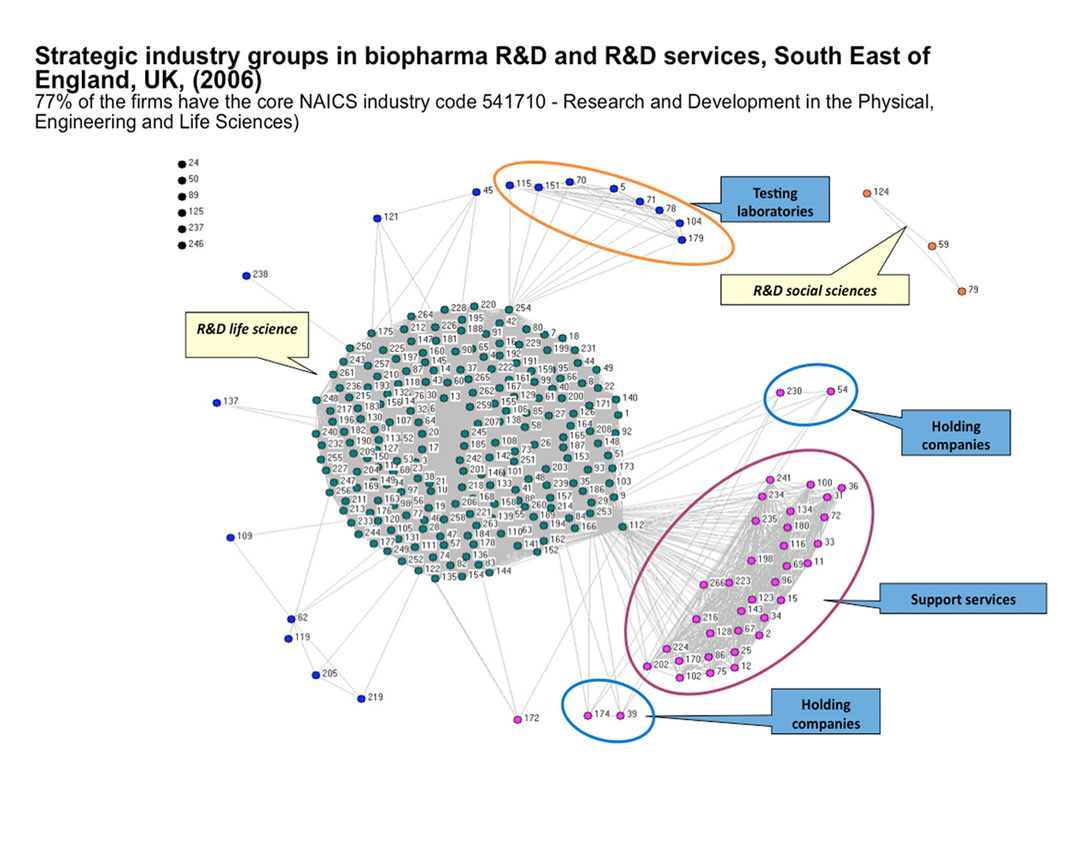
Strategic industry groups in biomedical and health technology
 Strategic industry groups in biopharma R&D and R&D services, South East of England
 (2006)
Research and development in the physical engineering and life sciences
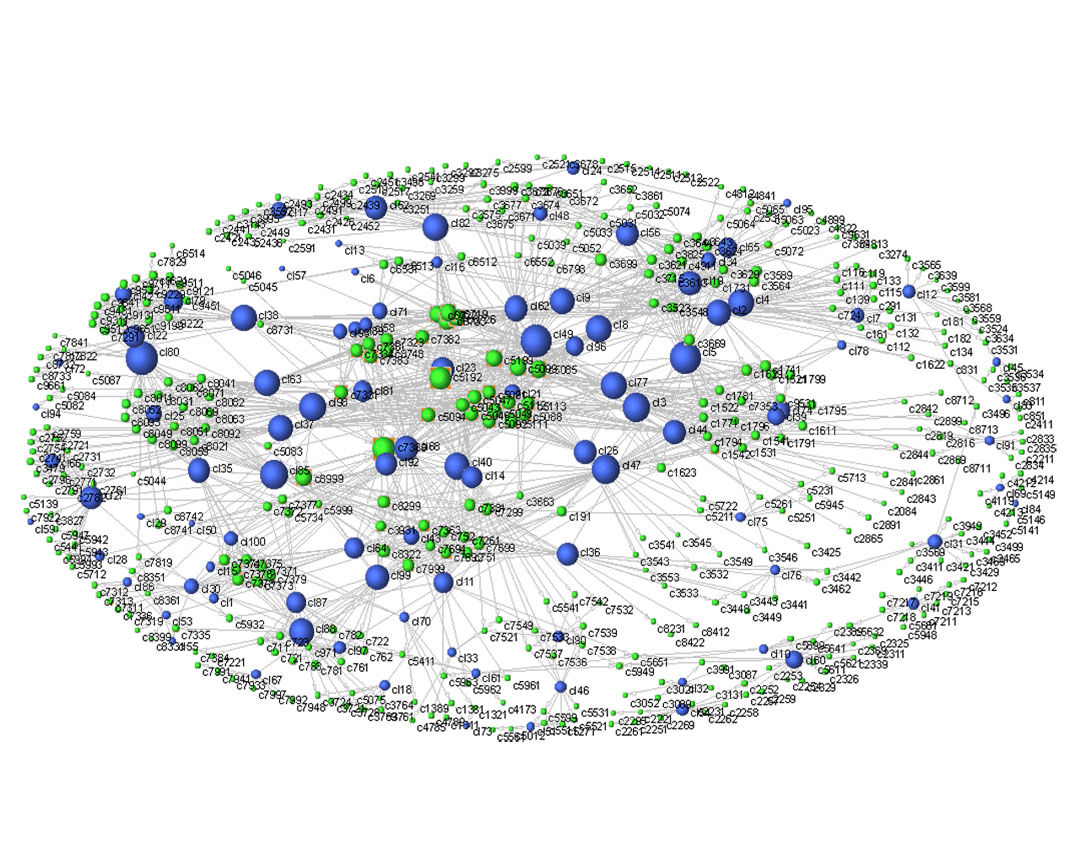
 Biopharma ownership ties
 (2016)
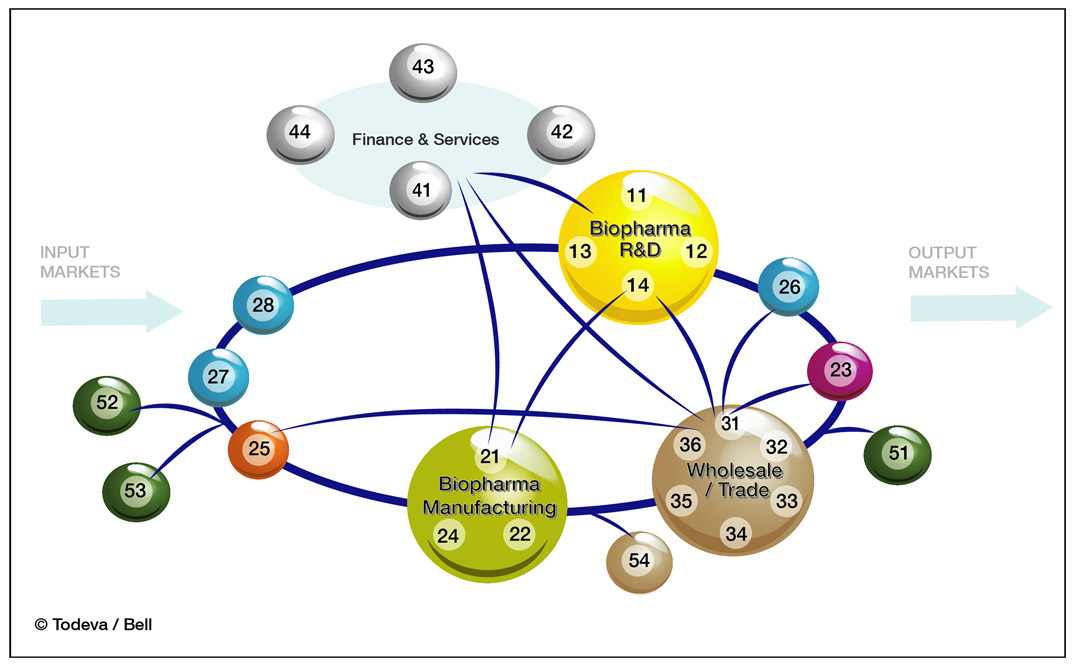
Relationships between Finance & services, Biopharma R&D, Biopharma Manufacturing, Wholsales / Trade, Input and outputs markets
Copyright © 2021 - All Rights Reserved
Template by OS Templates