Mapping Techniques
Mapping Techniques - Competition Entry for “Science Maps for Scholars” (2010)
These maps were produced as part of the competition entry for the 6th Iteration of ‘Places and Spaces: Mapping Science’, which was dedicated to "Science Maps for Scholars" (2010). We developed 2-D and 3-D representations of the Health Technology and Life Science Cluster in the Greater South East, UK. Our maps contain conceptual mapping of value-chains, representations of 2-mode networks, and the use of advanced methods for mapping of relational data in a geographic space. All maps have been produced with UCINET and ArcGis software utilizing two comprehensive databases and extensive data transfer across software.
Authors: Dr. Emanuela Todeva, Donka Keskinova, Hristo Karapchanski
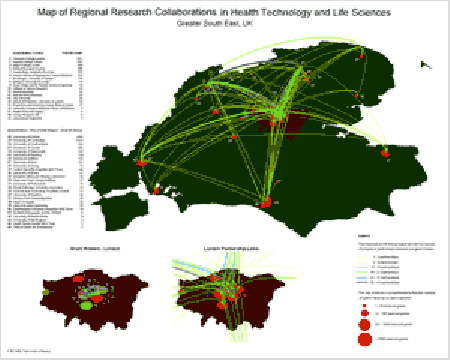
This map is drawn from the first comprehensive database of public research grants for Health Technology and Life Science research in the Greater South East (GSE) region in the UK. Dr. Emanuela Todeva from the University of Surrey, UK and a team from the BCNED (Business Clusters, Networks and Economic Development) research group have developed a new methodology and tools that combine network analysis with geographic mapping for the visualization of network relationships and partnership data in a 3-D geographic environment.
The GSE region as a whole is a host for 61 Universities and University Hospitals that have received, over £ 4,3 bln GBP research funding for the period 2000-2007. Although substantial part of the grants are awarded to projects that include wider national and international partners (total of 439 partner institutions worldwide), more then 62% of these funded project partnership are located within the GSE region. The 45 research institutions in the GSE region that have received grants in partnership are displayed in this map. The map reveals that the regional collaborations are lead by four major partners - University of Oxford, University of Cambridge, University College London and Imperial College, which have between 104 and 72 partners each – both in the region and worldwide.
Mapping research network partnerships in a geographic space reveals major insights into the concentration of funded research. The thickness of the lines in the map represents the consolidation of certain partnerships through multiple projects and the size of the pies represents the total number of grants received by each partner. The partner affinity is an explicit indicator for policy makers and funding bodies of the complementary in research capabilities in the GSE region.
Dr. Emanuela Todeva and her team from the University of Surrey, BCNED Research Group, have developed a new methodology for regional and industry cluster mapping that utilizes a comprehensive database of all regional firms that have output in medical and health technology research, manufacturing and trade. The methodology enables research of specialized and interconnected cluster activities within clear industrial and geographic boundaries. The database enables scientists to monitor location, concentration and performance of specialized groups of firms. Four related groups of firms, representing bio-pharma manufacturing and trade activities, are depicted in this map.
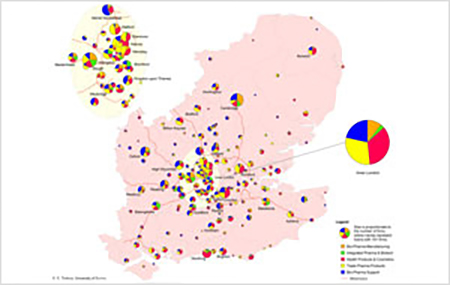
The four mapped cluster groups can be compared on the map in terms of size of the group by number of firms in individual locations. The significant presence of Bio-pharma support (in blue) and Bio-pharma trading firms (in yellow) explains to some extent the high regional concentration of specialized and integrated bio-pharma manufacturing firms (in orange and green respectively). The geographic mapping of data on firm location, employment and performance is completed with ArcGis software and informs directly business research and policy decisions.
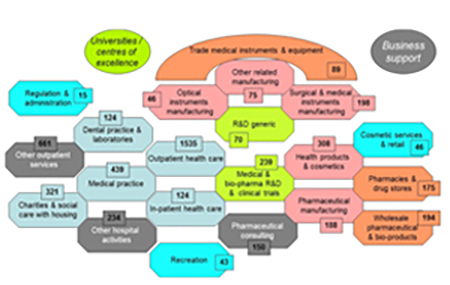
This conceptual map is a representation of the value chain activities in Health Technology and Life Sciences in the Greater South East, UK. The map identifies areas of specialization in a technology intensive sector of the economy, where value-added flows across multiple groups of firms.
Mapping Value Chain Networks has been based traditionally on analytical work supported by case research and expert evaluation. This new methodology for mapping of value chain activities utilizes a comprehensive database of firms, subjected to cluster analysis and network analysis techniques. The methodology enables researchers to draw clear boundaries between industry sectors and segments where diversified firms with complex technologies operate.
Dr. Emanuela Todeva from the University of Surrey, UK and a team from the BCNED research group have identifies the leading groups of firms that develop, test, manufacture, sell and employ medical and health technologies. The entire value chain is centred around two distinctive R&D groups (in green) – one engaged in Bio-pharma R&D, and the other – providing R&D support in the form of research supplies, contract medical research, clinical trials, and other related engineering R&D. The output from the R&D firms is sold either to the bio-pharma, and medical devices manufacturers (coloured in pink), or integrated into the diagnostics and telecare groups with more engineering input. The ultimate destination of value-added products in this value chain is aimed at the three health care segments (in light blue), or the specialized retail and wholesale groups (in orange).
This conceptual map of the value chain in Health Technology and Life Sciences highlights the competitive relationships in each segment and the synergies, reaped across the region. The map contributes to the scientific knowledge on strategic management in technology intensive sectors.
Mapping of the location of clusters and networks provides critical insights into regional concentrations of skills and competences.
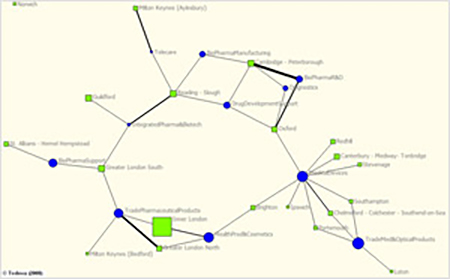
Dr. Emanuela Todeva and the team at the BCNED research group have used two-mode networks to identify significant relationships between concentration of firms in specific industry segments (clusters) and the concentration of their specialized capabilities in specific locations – or sub-regions in the Greater South East in the UK. This two-mode network reveals hidden relationships between industry concentrations and regional specialization, and enable scientific assessment of the competitive forces at industry and regional level. Similarities between regions (Oxford and Cambridge-Peterborough) can be interpreted as driving competition, while differences in concentration of competences (Greater London-South and Greater London-North) represent complementarities across the sector.
The map of the sub-regional distribution of competences is produced using a comprehensive database of firms in the Health Technology Cluster in the Greater South East, UK, and represents data of number of firms, their location and activities. The size of the dots (ex. Inner London) represents higher concentration of firm activities. Isolated dots (ex. Norwich) represent concentration of firms that do not exhibit any significant specialization within the health technology value chain.